SQL Server AAG: failed to obtain cluster information. either the specified instance of SQL Server is not running on a windows server failover cluster (WSFC) node, or the user lacks sysadmin permissions on the SQL Server instance to obtain the cluster information.

You get the following error when trying to add a node to an AlwaysOn Availability Group.

failed to obtain cluster information. either the specified instance of SQL Server is not running on a windows server failover cluster (WSFC) node, or the user lacks sysadmin permissions on the SQL Server instance to obtain the cluster information.

The first things to check are the following;

1) check always-on is enabled in SQL configuration manager or run SELECT SERVERPROPERTY (‘IsHadrEnabled’);
2) check you are local admin on all nodes 
3) check cluster permission by right click on properties of the  windows cluster in fail-over cluster  manager

There is also a qwerk with SQL Server, where if you Enable the AlwaysOn Availability Group setting before the node is added to the cluster then you get this error when trying to add the node to the AAG. You need to Add the node to the WSFC THEN Enable this option. If you’re in doubt then this option can be unchecked then checked again, how ever this will need a SQL Server Service restart.

LogShipping Error: Unhandled Exception: System.IO.FileLoadException: Mixed mode assembly is built against version ‘v2.0.50727’ of the runtime and cannot be loaded in the 4.0 runtime without additional configuration information

You will see the following error in the SQL Agent job history for the LogShipping Job;

Unhandled Exception: System.IO.FileLoadException: Mixed mode assembly is built against version ‘v2.0.50727’ of the runtime and cannot be loaded in the 4.0 runtime without additional configuration information

This is because SQLLogshipping is trying to use mixed-mode assemblies for .netframework, To use mixed-mode assemblies in .NET Framework 4.0, it must be configured in the configuration file for that application.

SQLServer.exe and SQLAgent. exe applications are in the C:\Program Files\Microsoft SQL Server\MSSQL13.MSSQLSERVER\MSSQL\Binn Directory, here you have the corresponding .config files. However, log shipping is in C:\Program Files\Microsoft SQL Server\130\Tools\Binn which has its own separate application there for its own .config file.

The sqllogship.exe.config file needs to be added to allow legacy v2 runtime, as the following MS Article describes; https://docs.microsoft.com/en-us/troubleshoot/dotnet/framework/sgen-mixed-mode-assembly-built-v2-0-50727

sqllogship.exe.config should look something like this, once modified.

SQL Server & SQL Agent DOES NOT require a reboot for this change to work. just execute the log shipping job again and it should read the new config file (and hopefully work for you.)

Finding Queries From SQL Server Missing Index Requests

When I do performance tuning I look at it from both ways, the most expensive queries and the indexes which SQL Server is already recommending. Now just because an expensive query doesn’t have an index recommendation against it doesn’t mean that its performance cannot be improved by adding or changing an index for it…. but that’s another subject. I’m saying that because you shouldn’t just look at what SQL Server recommends and blindly implement them or accept them as the only things which can be improved.

Index Recommendations.

Now I normally look at what SQL Server is recommending from the sys.dm_db_missing_index_details DMV and compare them against the expensive queries to see how they can be tuned, see what can be ignored, and what would be beneficial. however, I’ve recently come across another script, which will display all the plans that SQL Server used to come up with the index recommendation;

WITH XMLNAMESPACES (DEFAULT ‘http://schemas.microsoft.com/sqlserver/2004/07/showplan’)
, PlanMissingIndexes
AS (SELECT query_plan, usecounts
FROM sys.dm_exec_cached_plans cp
CROSS APPLY sys.dm_exec_query_plan(cp.plan_handle) qp
WHERE qp.query_plan.exist(‘//MissingIndexes’) = 1)
, MissingIndexes
AS (SELECT stmt_xml.value(‘(QueryPlan/MissingIndexes/MissingIndexGroup/MissingIndex/@Database)[1]’, ‘sysname’) AS DatabaseName,
stmt_xml.value(‘(QueryPlan/MissingIndexes/MissingIndexGroup/MissingIndex/@Schema)[1]’, ‘sysname’) AS SchemaName,
stmt_xml.value(‘(QueryPlan/MissingIndexes/MissingIndexGroup/MissingIndex/@Table)[1]’, ‘sysname’) AS TableName,
stmt_xml.value(‘(QueryPlan/MissingIndexes/MissingIndexGroup/@Impact)[1]’, ‘float’) AS Impact,
ISNULL(CAST(stmt_xml.value(‘(@StatementSubTreeCost)[1]’, ‘VARCHAR(128)’) AS FLOAT), 0) AS Cost,
pmi.usecounts UseCounts,
STUFF((SELECT DISTINCT ‘, ‘ + c.value(‘(@Name)[1]’, ‘sysname’)
FROM stmt_xml.nodes(‘//ColumnGroup’) AS t(cg)
CROSS APPLY cg.nodes(‘Column’) AS r(c)
WHERE cg.value(‘(@Usage)[1]’, ‘sysname’) = ‘EQUALITY’
FOR XML PATH(”)),1,2,”
) AS equality_columns,
STUFF(( SELECT DISTINCT ‘, ‘ + c.value(‘(@Name)[1]’, ‘sysname’)
FROM stmt_xml.nodes(‘//ColumnGroup’) AS t(cg)
CROSS APPLY cg.nodes(‘Column’) AS r(c)
WHERE cg.value(‘(@Usage)[1]’, ‘sysname’) = ‘INEQUALITY’
FOR XML PATH(”)),1,2,”
) AS inequality_columns,
STUFF((SELECT DISTINCT ‘, ‘ + c.value(‘(@Name)[1]’, ‘sysname’)
FROM stmt_xml.nodes(‘//ColumnGroup’) AS t(cg)
CROSS APPLY cg.nodes(‘Column’) AS r(c)
WHERE cg.value(‘(@Usage)[1]’, ‘sysname’) = ‘INCLUDE’
FOR XML PATH(”)),1,2,”
) AS include_columns,
query_plan,
stmt_xml.value(‘(@StatementText)[1]’, ‘varchar(4000)’) AS sql_text
FROM PlanMissingIndexes pmi
CROSS APPLY query_plan.nodes(‘//StmtSimple’) AS stmt(stmt_xml)
WHERE stmt_xml.exist(‘QueryPlan/MissingIndexes’) = 1)

SELECT TOP 200
DatabaseName,
SchemaName,
TableName,
equality_columns,
inequality_columns,
include_columns,
UseCounts,
Cost,
Cost * UseCounts [AggregateCost],
Impact,
query_plan
FROM MissingIndexes
WHERE DatabaseName = ‘[YourDatabaseName]’ AND TableName = ‘[YourTableName]’
ORDER BY Cost * UseCounts DESC;

This way, you can even see all the smaller, low-cost queries which SQL Server has built it’s recommendation from. I think this is amazing. I hope you have fun with it!

Parameter Sensitive Plan optimization (Intelligent Query Processing) – SQL Server 2022

Ignite 2021 Microsoft announced the release of SQL Server 2022, I just want to touch on one of the features I’m excited about in this release

Parameter Sensitive Plan optimization

With SQL Server 2022’s Parameter Sensitive Plan optimization feature, SQL Server automatically enables the generation of multiple active cached plans for a single parameterized statement. These cached execution plans will accommodate different data sizes based on the provided runtime parameter values.

BugBear

Parameter sniffing has been a bane to DBA’s for years. In a nutshell; a parameterized query gets executed, the parameter it’s executed with needs to bring back lots of results, so the query optimizer says “Yeah, let’s do an index scan” and rightly so. Then the same query gets executed with a different parameter, this parameter only returns a few bits of data, so an index seek would be more appropriate, however, in the plan cache this query has already been told to do an index scan, so it does… a massive waste of resources.

Previously, the main ways of resolving issues with parameter sniffing were through indexing or adding the OPTION(RECOMPILE) to the SQL Query/Stored Procedure. These were often not ideal resolutions, as you can imagine, having to recompile your query for every execution is going to have its own overhead with performance.

Big Old Bloat

I’m really hoping Microsoft gets this right, it’s going to be interesting to see this in action when SQL Server 2022 is available for testing. however, I’ve got a sneaking suspicion that with SQL Server caching multiple plans for the same query we might start seeing plan cache bloat. for instance, if SQL Server is caching a new plan for each individual parameter, depending on how many variations of parameters there are you could end up with 100’s of plans for a single parameterized query. hopefully, this won’t be the case, and there would be some communication with the cardinality estimator to store the parameters in ranges or groups (or something).

Fingers crossed Microsoft. let’s hope this is the last we see of parameter sniffing!

SQL Server Performance: Disk Latency

Generally speaking, SQL Server these days is limited by Disk Read/Write speed. This means that the most important factor in a SQL server’s performance is its ability to perform I/O operations quickly. If the I/O subsystem cannot keep up with the demand being placed on it, then the SQL Server workload will suffer performance problems.

SQL Server is slow. It looks like the disks…

A problem I’ve seen in the past is relating increased I/O subsystem latencies with poor I/O subsystem performance. This is why baselining systems is so important, or at least have some monitoring in place where you can see trending on these sorts of metrics. The I/O subsystem may have been performing fine when running on the designed workload, but it suddenly becomes the performance bottleneck when the workload increases past the I/O subsystem design point. The workload increase, in this case, is what’s causing the problem, not the disk subsystem.

Right? why are you telling me this

Don’t just go online, read some blog that says “This is how you diagnose disk issues” then run off and annoy your infrastructure team telling them their disks are broken. that’s not going to win you any friends.

A Script…….

Your first step is knowing if I/O latency has increased. This script uses sys.dm_io_virtual_file_stats to display the disk latency information

SELECT
[ReadLatency] =
CASE WHEN [num_of_reads] = 0
THEN 0 ELSE ([io_stall_read_ms] / [num_of_reads]) END,
[WriteLatency] =
CASE WHEN [num_of_writes] = 0
THEN 0 ELSE ([io_stall_write_ms] / [num_of_writes]) END,
[Latency] =
CASE WHEN ([num_of_reads] = 0 AND [num_of_writes] = 0)
THEN 0 ELSE ([io_stall] / ([num_of_reads] + [num_of_writes])) END,
[AvgBPerRead] =
CASE WHEN [num_of_reads] = 0
THEN 0 ELSE ([num_of_bytes_read] / [num_of_reads]) END,
[AvgBPerWrite] =
CASE WHEN [num_of_writes] = 0
THEN 0 ELSE ([num_of_bytes_written] / [num_of_writes]) END,
[AvgBPerTransfer] =
CASE WHEN ([num_of_reads] = 0 AND [num_of_writes] = 0)
THEN 0 ELSE
(([num_of_bytes_read] + [num_of_bytes_written]) /
([num_of_reads] + [num_of_writes])) END,
LEFT ([mf].[physical_name], 2) AS [Drive],
DB_NAME ([vfs].[database_id]) AS [DB],
[mf].[physical_name]
FROM
sys.dm_io_virtual_file_stats (NULL,NULL) AS [vfs]
JOIN sys.master_files AS [mf]
ON [vfs].[database_id] = [mf].[database_id]
AND [vfs].[file_id] = [mf].[file_id]
— WHERE [vfs].[file_id] = 2 — log files
— ORDER BY [Latency] DESC
— ORDER BY [ReadLatency] DESC
ORDER BY [WriteLatency] DESC;
GO

The counters are initialized to empty whenever the SQL Server service is started. so the I/O times reported by the script are averages. The longer the time the data set covers, the more likely it is that transient latency spikes will be masked.

So what are acceptable values?

Well, That depends. It comes down to what I was explaining earlier, your normal workload might be running at 50ms latency and that might be fine. this is why it’s important to capture a baseline of the system during day-to-day usage with no reported problems, then you can compare it to when issues are being reported. That being said, I would generally suggest that anything over 100ms is slow. certainly 500+ should be of concern.

This can even go the other way. on a critical system you might have 1-5ms. and performance problems being reported when latency starts hitting 10ms, but you dont have a baseline of the system so you dont know. you run this script and see latency is only 10ms so dont think it’s cause for concern and ignore it.

Don’t shout wolf

If latency has increased, look for changes in SQL Server behavior before blaming the I/O subsystem. For instance:

  • Query plan changes
  • Increased workload
  • Out of date statistics
  • Fragmented or Missing indexes
  • Code changes
  • Decreased memory pool

SQL Server SPN & Kerberos Authentication

SQL Server uses NTLM Authentication if the SPN Fails to be created when SQL Server is started. It can be configured to use Kerberos by registering the SPN for the SQL Server;

NTLM Vs Kerberos What’s it all about?

NTLM & Kerberos are authentication protocols. NTLM was the default protocol used in old windows versions, but it’s still used today. If for any reason Kerberos fails

KerberosNTLM
Kerberos supports delegation of authentication in multi-tier application.NTLM does not support delegation of authentication.
Kerberos supports two factor authentication such as smart card logon.NTLM does not provide smart card logon.
Kerberos has the feature of mutual authentication.NTLM does not have the feature of mutual authentication.
Kerberos provides high security.While NTLM is less secured as compared to kerberos.

So what does this have to do with me?

The main reason we are interested in it for SQL Server is the delegation of authentication. meaning we can start connecting to sql server through SSMS from other servers. Without Kerberos Authenticaiton, when you try and connect to SSMS remotely, you will get an “Cannot generate SSPI context’ Error.

Gotcha, So how do we use it?

In order to use Kerberos authentication, you need to register the Service Principal Name (SPN) for SQL Server. SQL Server tries to do this automatically when the SQL Server Service Starts. you will see an entry on the SQL Error log, declaring if the SPN Was created Successfully or not.

SQL Server can only create the SPN Automatically if the SQL Server Service Account has permissions to create the SPN in Active Directory. The permissions required for this are the “Read servicePrincipalName” and “Write servicePrincipalName”.

And how do we apply the permissions to register the SPN Automatically?

Open Active Directory Users and Computers.
To open Active Directory Users and Computers, click Start, click Run, type dsa.msc, and then press ENTER.
Click View, and verify that the Advanced Features check box is selected.
Click Advanced Features, if it is not selected.
In the console tree, right-click the node that represents the domain to which you want to allow a disjoint namespace, and then click Properties.
On Security tab, click Advanced.
On the Permissions tab, click Add.
In Enter the object name to select, type the group or user account name to which you want to delegate permission (This is the SQL Server Service account), and then click OK.
Configure the Apply onto box for Computer objects.
At the bottom of the Permissions box, select the Allow check box that corresponds to the Validated write to service principal name permissions, and then click OK on the three open dialog boxes to confirm your changes.
Close Active Directory Users and Computers.

But I cannot give these permissions, cant i create a SPN Manually?

Of course. however it’s recommended that the permissions are granted.

Run the following command in an elevated command prompt, with your Server/Account Details;

setspn -A MSSQLSvc/<Server Name> <Account Name>

Alternatively, Microsoft have a very useful tool called “Microsoft Kerberos Configuration Manager” This tool lets you connect to the server and fix any SPN Issues you might have

SQL Server AAG – The Importance of WSFC Quorum Voting.

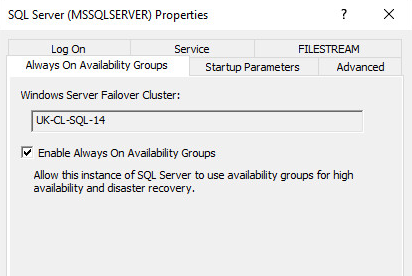
SQL Server Always on uses the Windows Server Failover Clustering(WSFC) Technology. WSFC uses a quorum-based approach(minimum number of members that must be present to make the proceedings valid) to monitoring overall cluster health and maximize node-level fault tolerance.

Each node in a WSFC cluster participates in periodic heartbeat communication to share the node’s health status with the other nodes. Unresponsive nodes are considered to be in a failed state. A quorum node set is a majority of the voting nodes and witnesses in the WSFC cluster. The overall health and status of a WSFC cluster is determined by a periodic quorum vote. 

If a WSFC cluster is set offline because of quorum failure, manual intervention is required to bring it back online.

So what voting modes can we use?

quorum mode can be configured at the WSFC cluster level, The Failover Cluster Manager utility will recommend a quorum mode based on the number of nodes in the cluster.

  • Node Majority. More than one-half of the voting nodes in the cluster must vote affirmatively for the cluster to be healthy.
  • Node and File Share Majority. Similar to Node Majority quorum mode, except that a remote file share is also configured as a voting witness, and connectivity from any node to that share is also counted as an affirmative vote. More than one-half of the possible votes must be affirmative for the cluster to be healthy.As a best practice, the witness file share should not reside on any node in the cluster, and it should be visible to all nodes in the cluster.
  • Node and Disk Majority. Similar to Node Majority quorum mode, except that a shared disk cluster resource is also designated as a voting witness, and connectivity from any node to that shared disk is also counted as an affirmative vote. More than one-half of the possible votes must be affirmative for the cluster to be healthy.
  • Disk Only. A shared disk cluster resource is designated as a witness, and connectivity by any node to that shared disk is counted as an affirmative vote.

So technically anything could have a vote? a disk, a file share, nodes…

Yes, By default, each node in the WSFC cluster is included as a member of the cluster quorum; each node has a single vote in determining the overall cluster health, and each node will continuously attempt to establish a quorum. 

So in a 2 node cluster could we just have 1 node that votes and the other isn’t allowed?

No, An individual node in a WSFC cluster cannot definitively determine that the cluster as a whole is healthy or unhealthy. At any given moment, from the perspective of each node, some of the other nodes may appear to be offline, or appear to be in the process of failover, or appear unresponsive due to a network communication failure. A key function of the quorum vote is to determine whether the apparent state of each of node in the WSFC cluster is indeed that actual state of those nodes.

So what’s the risk of only having 2 voting nodes?

When more than one voting nodes is able to establish a quorum on its own, that is known as a split-brain scenario. In such a scenario, the nodes in the separate quorums may behave differently, and in conflict with one another. this scenario is more likely when performing a forced failover; explicitly subdividing the quorum node set.

If split-brain Occurs, you’re more than likely going to see problems at AAG Level. you might see that more than 1 nodes thinks it’s primary. this can cause databases to become out of sync, in-accessible and transaction log build up might occur. eventually, if not right away you’re going to see outages.

So what’s the recommended was to achieve quorum in a 2 node cluster?

The easiest way is a file share witness. this is easily configurable, other options are;

  • Add a 3rd node(which would be relative waste of resources)
  • A shared disk (requires setting up a clustered disk)
  • A Cloud witness (Possible Security risks, requires cloud access, may incur additional costs)

Note, You’re always looking to achieve an odd number of votes. if you have more than 2 nodes in your cluster you can start looking at setting the node voting weight and you may be able to achieve a reliable quorum this way.

Restoring historic files on AWS EC2 Instances

In order to do this you will need access to the AWS Console. you will need permission to restore snapshots and mount volumes.

So Why would we need to recover old files?

Well, the most common reason is for historic SQL Server backups. if you need to recover a database from a backup which was taken last week, it’s unlikely that .bak file will still be on disk. now with it being in AWS, disks are backed up via a snapshot at a particular time in the day. (no more of this restore from tape nonsense!)

So how do we do it?

Find your Instance ID (This is the AWS Name for the EC2 Instance you’re running).

Go To: Services > EC2 > Instances

You should See your EC2 Instances name with an Instance ID (Note this down)

Click on the Instance ID then go to Volumes. Note down the Volume ID for the disk which the file you need to recover is on.

in the left hand navigation pane, go to Elastic Block Store > Snapshots

In the top Filter Section, Filter on Volume ID

Now it’s a case of scrolling through the Snapshots, finding the date you require. Right Click on the Snapshot, Click Create Volume.

This will run through a volume creation wizard, you should be able to just click next and okay. this will also give you a new Volume ID (Note this down)

Under Elastic Block Store > Volumes you should see your new volume. Right Click the volume, and Attach Volume to your EC2 Instance. this will then attach the volume as a disk on your server.

Now you need to Log on to your Server go to Disk Management you should see a new disk in an Offline state. Right Click and Bring Online Assign the disk a drive letter that isn’t in use. You should see the disk in My Computer. this new disk will have all the files on when the snapshot was taken. (Hopefully including the files you’re looking to restore!)

Phew! Easy right?

Don’t forget to clean up the Volume once you’re done. you don’t want to be charged for the additional storage costs for mounting a disk which isn’t used!

When you’re done, go to Elastic Block Store > Volumes > Right Click the recovered volume > Detach Volume > Right Click again > Delete Volume

BE CAREFUL! YOU DONT WANT TO DETACH OR DELETE A DISK THAT IS IN USE! MAKE SURE YOU’RE WORKING WITH THE ID’S WHICH YOU’VE NOTED DOWN

Windows Server VMWare Memory Over Subscription

VM Basics…

With Virtual Servers, they all sit on a Host server, this is a physical server. These physical servers are usually massive beasts, we are talking anywhere between 128gb ram+ with 32cores etc etc… specing out these massive servers allows you to run multiple “Guest” Servers on the host. this gives you the ability to scale out the resources easier to each guest operating system.

VMware Memory Ballooning

Well… infrastructure engineers like to get value out of their resources. and when a server is allocated 10gb ram, they assume that server isn’t going to be using that allocation constantly. so they allow the VM’s to share the resources, allowing the host to reclaim resources back when they are not used & are required elsewhere.

Okay so What Is Memory Over Subscription?

It’s the process of subscribing more memory out to your guest operating systems than you physically have on the server. Think if we had a 100gb memory server. with 10guests each with 10gb of ram allocated, we have used our 100gb. but that memory wont be used at the same time, so at host level, your infrastructure engineers might see that although 100% of the ram has been allocated, only 50% of the ram is actually being used.

Value for money

This is where infrastructure guys like to make their money back, they will see it’s safe to add a couple more Guests on the host, so our 100gb server, might go up to 12guests, with 10gb each, that’s a 120gb allocation, but it’s fine because still only 60% of the ram is actually being used right?…

How does this effect SQL Server?

SQL Server, it’s pretty selfish. it doesn’t like to give memory back, but it will, and it will trim down it’s memory allocation to the minimum working set to satisfy the request of the host. it’s got no choice in the matter after all…. and this is where you will start to see performance issues, plans will start spilling to tempdb, the working set with page to disk (if you haven’t configured LPIM) it all gets rather horrible.

So how do we avoid it?

This is completely infrastructure, avoid over subscribing resources!

Memory Grant Feedback (Intelligent Query Processing) – SQL Server 2019

Row Mode Memory Grant Feedback was a new feature introduced in SQL Server 2019, it expands on the existing Batch Mode Memory Grant Feedback which was introduced in SQL Server 2017.

Okay so what is it?

After a query executes, the query’s post-execution plan includes ideal memory grant size to have all rows fit in memory. Performance suffers when memory grant sizes are incorrectly sized. Excessive grants result in wasted memory and reduced concurrency. Insufficient memory grants cause expensive spills to disk.

With Memory Grant Feedback; Consecutive executions of a query will result in SQL Server adjusting the memory grant to better allocate it’s resources, reducing excessive grants, or preventing spills to disk.

There are now two new query plan attributes will be shown for actual post-execution plans IsMemoryGrantFeedbackAdjusted and LastRequestedMemory.

LastRequestedMemory shows the granted memory in Kilobytes (KB) from the prior query execution. IsMemoryGrantFeedbackAdjusted attribute allows you to check the state of memory grant feedback for the statement within an actual query execution plan. Values surfaced in this attribute are as follows:

IsMemoryGrantFeedbackAdjusted ValueDescription
No: First ExecutionMemory grant feedback does not adjust memory for the first compile and associated execution.
No: Accurate GrantIf there is no spill to disk and the statement uses at least 50% of the granted memory, then memory grant feedback is not triggered.
No: Feedback disabledIf memory grant feedback is continually triggered and fluctuates between memory-increase and memory-decrease operations, we will disable memory grant feedback for the statement.
Yes: AdjustingMemory grant feedback has been applied and may be further adjusted for the next execution.
Yes: StableMemory grant feedback has been applied and granted memory is now stable, meaning that what was last granted for the previous execution is what was granted for the current execution.

This sounds like a great feature!

It is, for the most part. There are some things to be careful with; with parameterised query’s the the result set can change dramatically. resulting in quite large discrepancies for memory grants between executions. now as you can see “If memory grant feedback is continually triggered and fluctuates between memory-increase and memory-decrease operations, we will disable memory grant feedback for the statement” This can cause some performance issues while the the database engine is figuring this part out, so there will be some executions where memory grants are either too large, or there are large spills to disk.

Then, you need to be careful for clearing your plan cache, once you clear your plan cache, SQL will forget about all the hard work it’s done for this parametrised query, resulting in poor performance for a short time.

Cant we just disable it and save us the trouble?

You can, but it’s my view that this feature, for the moment is giving us more help than hindrance. I haven’t seen any cases yet where disabling this option would be recommended for a server… I guess there are some edge cases, where absolutely every query you have is parametrised and your result sets are fluctuating consistently… then yes this feature wouldn’t be useful! but then you would be back to regular parameter sniffing issues.

Row mode memory grant feedback can be disabled at the database or statement scope while still maintaining database compatibility level 150 and higher. To disable row mode memory grant feedback for all query executions originating from the database, execute the following within the context of the applicable database

ALTER DATABASE SCOPED CONFIGURATION SET ROW_MODE_MEMORY_GRANT_FEEDBACK = OFF;

To re-enable row mode memory grant feedback for all query executions originating from the database, execute the following within the context of the applicable database

ALTER DATABASE SCOPED CONFIGURATION SET ROW_MODE_MEMORY_GRANT_FEEDBACK = ON;